Python in My Research Activities

Python is an extremely useful programming language. Python is now widely used for observational astronomy and astrophysics. I would like to introduce our/my python programs here.
-
•Sprout Code
See the Science page for details of the 1st three codes & tools for research highlights.
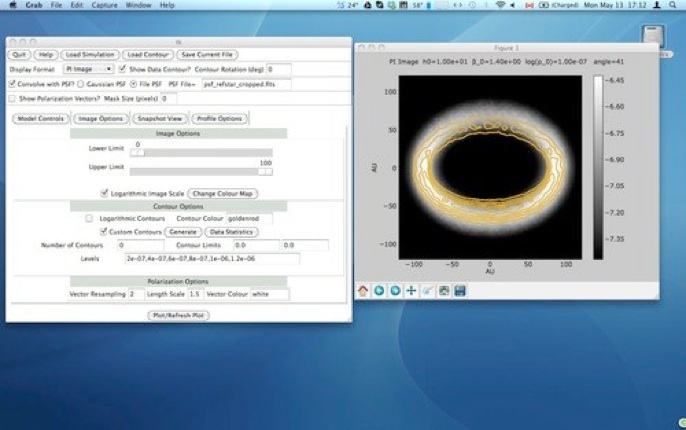
Sprout Code
Near-infrared images for a number of protoplanetary and debris disks have been observed during the large survey program “Strategic Explorations of Exoplanets and Disks at Subaru” (SEEDS). The near-infrared flux observed at these disks are scattered light from the star. To quickly interpret the observations, Drs. Jennifer Karr, Hyuson Kim (both were postdocs at ASIAA during the development) and myself developed the Sprout code, which is a combination of a Monte-Carlo scattering simulation code and GUI tools. Most parts are written in Python, while subroutines for scattering simulations are written in C for fast simulations. Jennifer has organized a beautiful www page including instructions and download info (here). The code has been used to model some observations (Takami, Karr, Hashimoto, Kim et al., 2013, ApJ; Follette et al. 2015, ApJ).
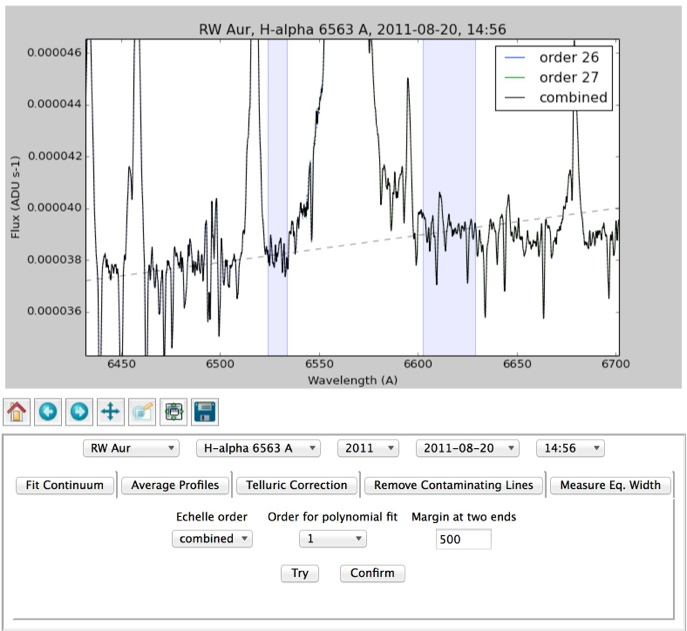
GUI Tool to Analyze Optical Emission Line Spectra from CFHT-ESPaDOnS
We have been conducting long-term monitoring of optical high-resolution spectra for active T Tauri stars to try to understand physical mechanisms of mass accretion and ejection in detail. We have so far made ~60 visits for four stars using CFHT ESPaDOnS. Each spectrum contain a number of emission lines. I am therefore developing a GUI tool to quickly carry out the analysis below:-
- Quick subtraction of and normalization by the continuum spectra
- Averaging line profiles for the same dates, automatically adjusting the weights to maximize the signal-to-noise
- Removal of telluric lines and contaminating lines
- Measure equivalent widths
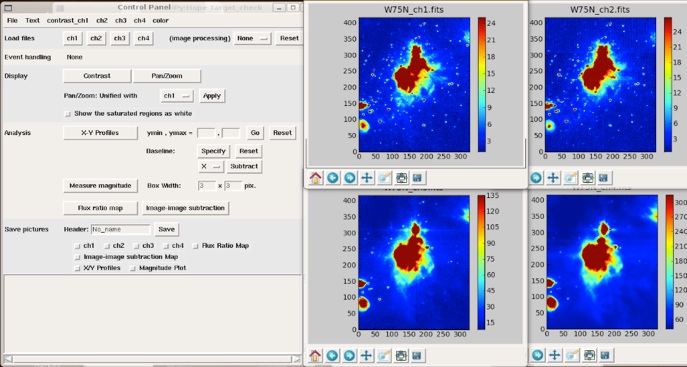
GUI Tool to Analyze Spitzer-IRAC Data
Infrared Array Camera (IRAC) on the Spitzer Space Telescope has provided a huge amount of data sets which are exceptionally useful for the above issues. The observations with four filters (3.6, 4.5, 5.8 and 8.0 μm) have shown that many young stellar objects and star forming regions are associated with extended infrared emission (see the science page for some examples). These are in many cases attributed to either shocks, scattered continuum in the outflow cavity, or PAH emission due to UV radiation from high-mass stars. The better understanding of these extended emission would allow further understanding for masses, evolutionary stages and activities of YSOs in detail.
I developed a GUI-based software to quickly analyzing the extended emission in IRAC data. The functions include:-
- Simultaneous display for IRAC data at four bands (3.6, 4.5, 5.8 and 8.0 μm)
- Quick convolution, background subtraction, subtraction of extended PAH emission
- Display 1D profiles, flux ratio map, image-image subtraction map at with arbitrary positions and areas
- Measure SEDs or obtain color-color diagrams with arbitrary positions or areas
The software should be able to be used for a variety of objects with infrared extended emission, such as supernova remnants, proto-planetary and planetary nebulae, and nearby galaxies. Also, it is extremely convenient not only for our research activities (Takami et al., 2010/2011/2012, ApJ), but also for letting students conduct good data analysis. The software was indeed used for the ASIAA Summer Student Program in 2010 and 2011. A poster presented at a workshop is available here (in Japanese).
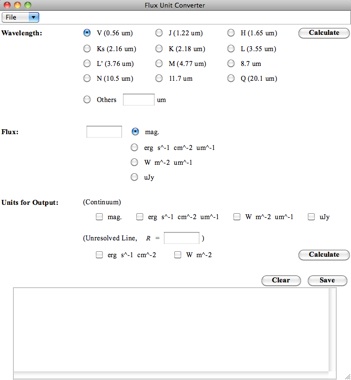
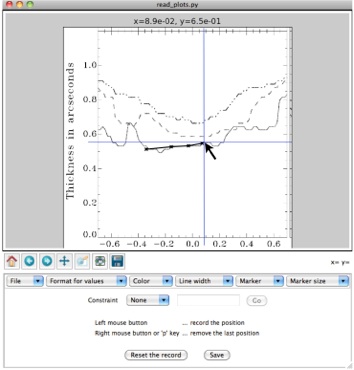
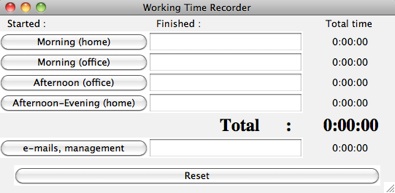
Other Programs and Libraries
Tools for reading values from papers; converting flux units; measuring hours for working each day etc. Go to English or Japanese pages for details. If you click each of the snapshots, you will directly jump to their instruction page. Downloads are available from the Summary or 一覧 page.
Last updated in May 2016